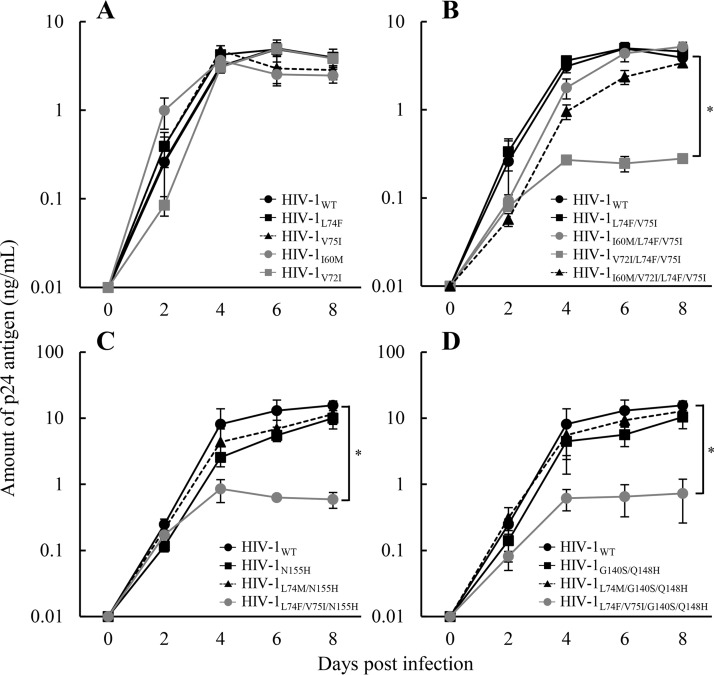
FIG 2.
Replication kinetics of HIV-1L74F V75I variants. Multicycle replication kinetics in MT-2 cells were assessed by measuring the p24 levels in culture supernatants. (A) Effect of each single mutation on HIV-1 replication. The data shown compare the replication kinetics of HIV-1WT (solid line with circles), HIV-1L74F (solid line with squares), HIV-1V75I (dotted line with triangles), HIV-1I60M (solid gray line with circles), and HIV-1V72I (solid gray line with squares). (B) Effect of I60M or V72I on HIV-1L74F V75I replication. The data shown compare the replication kinetics of HIV-1WT (solid line with circles), HIV-1L74F V75I (solid line with squares), HIV-1I60M L74F V75I (solid gray line with circles), HIV-1V72I L74F V75I (solid gray line with squares), and HIV-1I60M V72I L74F V75I (dotted line with triangles). (C) Effect of N155H on HIV-1L74F V75I replication. The data shown compare the replication kinetics of HIV-1WT (solid line with circles), HIV-1N155H (solid line with squares), HIV-1L74M N155H (dotted line with triangles), and HIV-1L74F V75I N155H (solid gray line with circles). (D) Effect of G140S Q148H on HIV-1L74F V75I replication. The data shown compare the replication kinetics of HIV-1WT (solid line with circles), HIV-1G140S Q148H (solid line with squares), HIV-1L74M G140S Q148H (dotted line with triangles), and HIV-1L74F V75I G140S Q148H (solid gray line with circles). Error bars represent standard deviations from at least three independent experiments. Statistical significance was calculated for difference between the p24 levels of HIV-1L74F V75I and HIV-1V72I L74F V75I (B) and the WT and mutant (C and D) at day 8 using a Student t test with a statistical cutoff of P < 0.02 (*).

