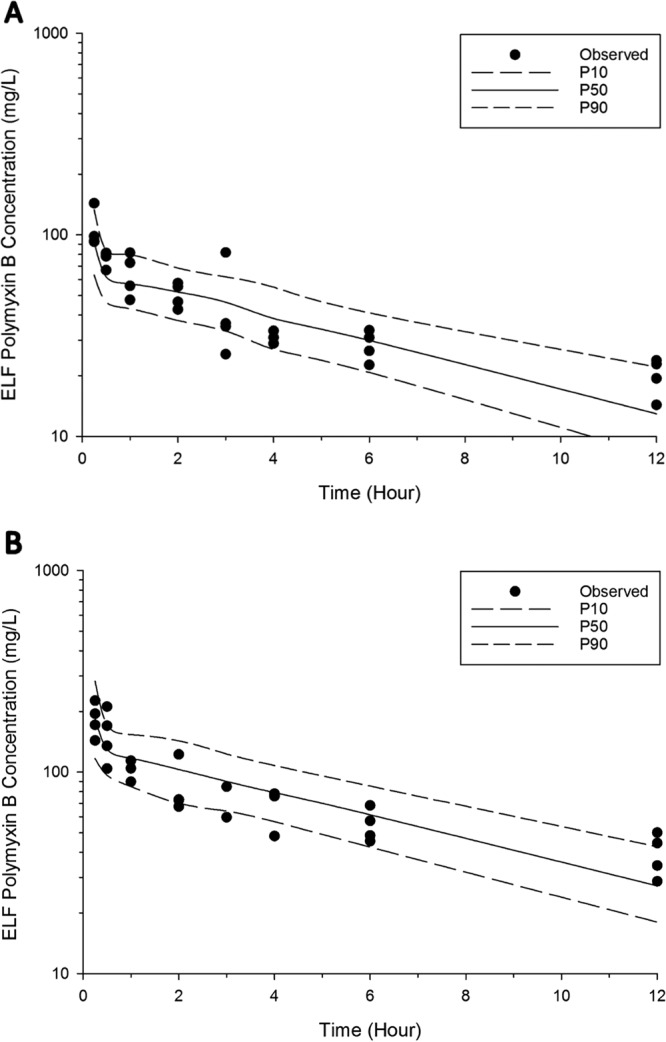
FIG 2.

Visual predictive checks for polymyxin B in ELF following pulmonary administration of 4.12 mg base/kg (A) and 8.24 mg base/kg (B). The solid line represents the median model-predicted concentrations (P50); the broken lines represent the model-predicted 10th (P10) and 90th (P90) percentiles. The solid dots represent the observed concentrations.
