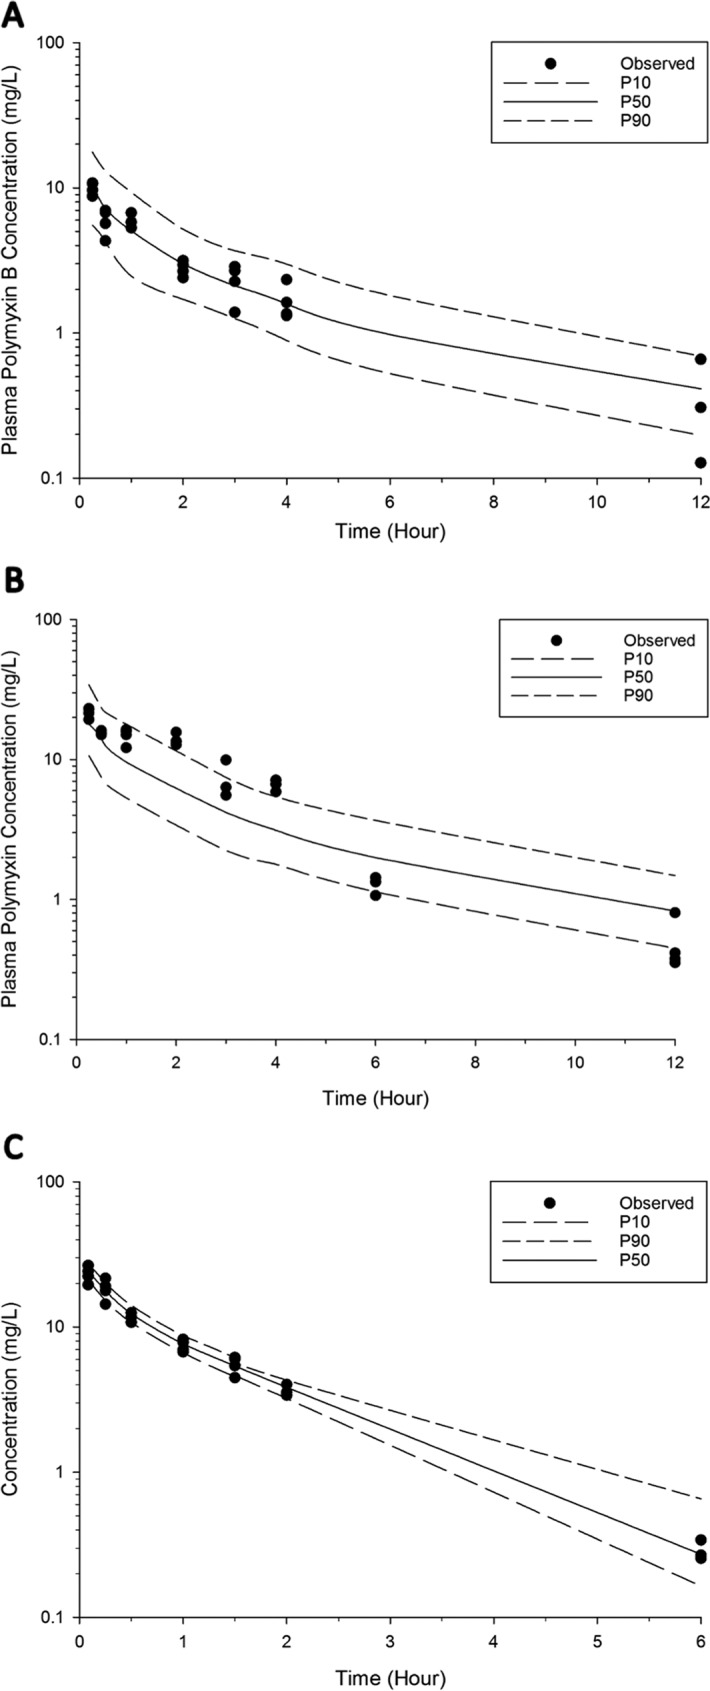
FIG 3.

Visual predictive checks for polymyxin B in plasma following pulmonary administration of 4.12 mg base/kg (A) and 8.24 mg base/kg (B) and intravenous administration of 4.12 mg base/kg (C). The solid line represents the median model-predicted concentrations (P50); the broken lines represent the model predicted 10th (P10) and 90th (P90) percentiles. The solid dots represent the observed concentrations. Six data points were excluded from the final population PK model.
