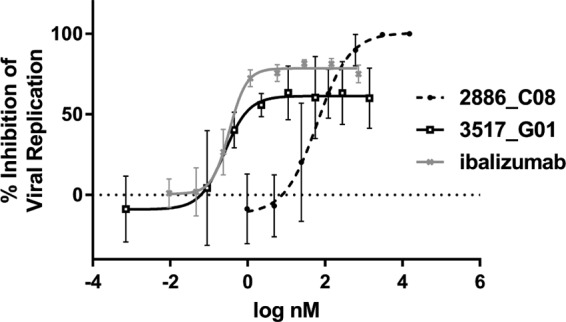
FIG 4.

Comparison of inhibition profiles. Overlay of representative inhibition curves for parental Adnectins in the replicating virus assay, with ibalizumab being used as a comparator. The data shown are the averages from 3 experiments ± 1 standard deviation. Best-fit curves were generated with a 5-parameter equation. 3517_G01 was more potent than 2886_C08 in terms of EC50, yet it did not achieve 100% inhibition.
