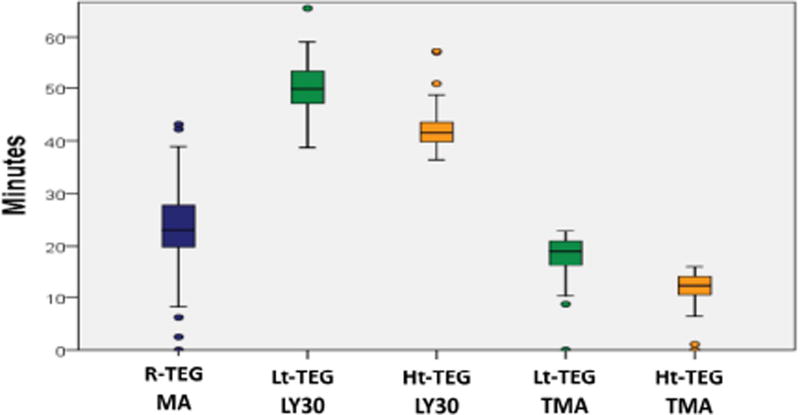
Figure 1.
Time to reach optimal cutoff to predict massive transfusion for the most predictive thrombelastography tests. Ht-TEG, high dose thrombelastography; Lt-TEG, low dose thrombelastography; LY30, percent clot lysis 30 minutes after reaching maximum amplitude; MA, maximum amplitude; R-TEG, rapid thrombelastography; TMA, time to maximum amplitude.

