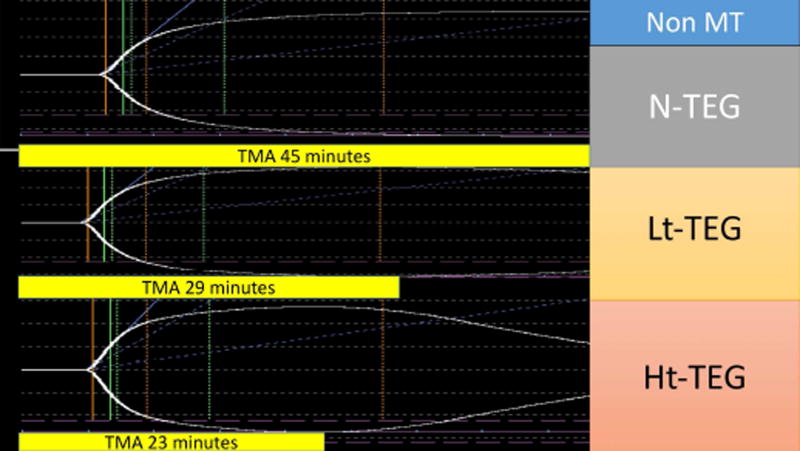
Figure 3.
Trauma patient not requiring a massive transfusion. The x-axis represents time of the thrombelastography (TEG) tracing and the y-axis represents the clot strength. The figure represents 3 native TEGs that were run in a parallel with no tissue plasminogen activator (tPA), low dose (Lt) tPA, and high dose (Ht) tPA. The yellow bars below each tracing represent the time in minutes required to reach the maximum clot strength. TMA, time to maximum amplitude.

