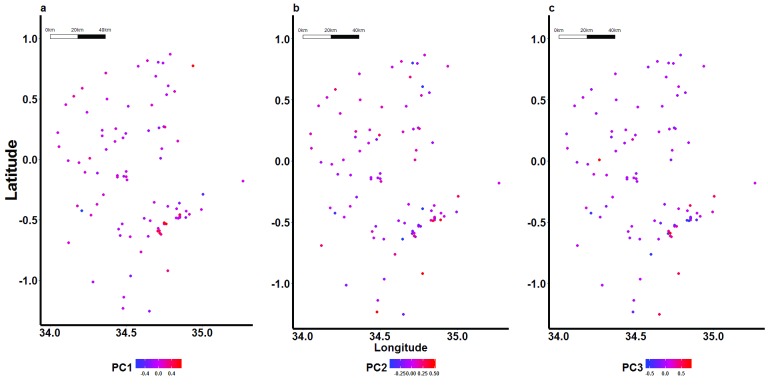
Figure 3. Spatial distribution of scores for the first 3 principal components (PCs) representing parasite genotypes.
Geospatial positioning information was collected at the school level, thus PC scores (values of the transformed variables corresponding to a specific data point) were aggregated for all samples in an individual school. Here each dot represents a school, and has been colour-coded based on the mean genotype score of all parasite isolates collected in that school. Cumulatively, the first three PCs accounted for only 10.78% of the variation observed in the genotype data (PC1=3.74%, PC2=3.54%, PC3=3.5%).

