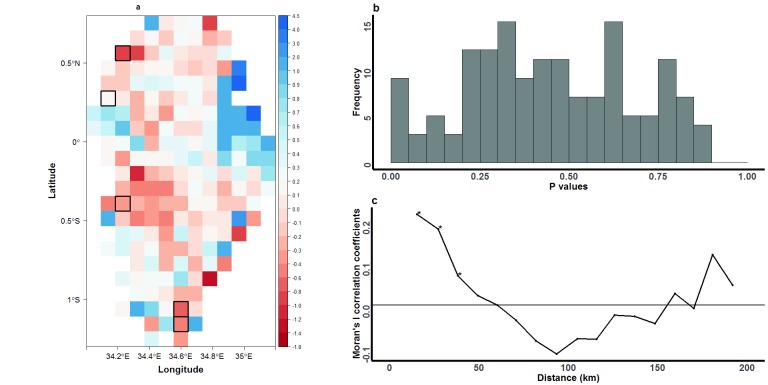
Figure 8. Raster analysis by pixels to examine patterns of north/south versus east/west directional movement of Plasmodium falciparum parasites in western Kenya.
( A) Each pixel represents a 10km-by-10km area of the region, and is colour-coded based on coefficient estimates describing the effect size of each pixel in influencing directional movement. Pixels that were statistically significant after correcting for multiple testing are highlighted with black borders. Grids were colour-coded to represent east/west (red) or north/south (blue) movement. ( B) Distribution of p values observed after bootstrapping the regression analysis (with 10,000 resampling steps) to determine the level of significance of pixels in influencing parasite directional movement. ( C) Moran’s I analysis to describe the spatial autocorrelation of movement within the region. The analysis was computed using geographical coordinates of individual pixels to represent feature locations and coefficient estimates derived from the bearing regression analysis to represent the associated feature values. Autocorrelation was computed for parasites grouped in 10km distance bands. Significant positive correlation coefficients (p<0.01; marked by asterisks) were observed for schools separated by up to 40 km within the 10km distance bands.

