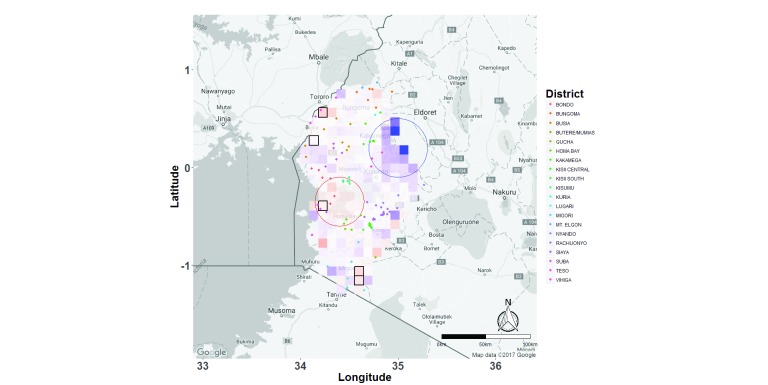
Figure 9. Map of the western Kenya study area with raster grids representing bearing analyses superimposed on top of it.
Multivariable linear regression analysis was carried out to determine bearing (directionality of movement) of Plasmodium falciparum parasites among schools in the region. Grids are colour coded based on the coefficient estimates describing the effect size of that grid in influencing directional movement. Red represents east/west movement, while blue represents north/south movement. The grids with black borders represent those areas that were significant in east/west movement, even after Bonferroni-correction for multiple testing. The blue circle shows the region of the study site that had predominantly north/south movement, while the red circle represents that region that had predominantly east/west movement. Each dot represents a school, colour-coded based on the district in which the school is located.

