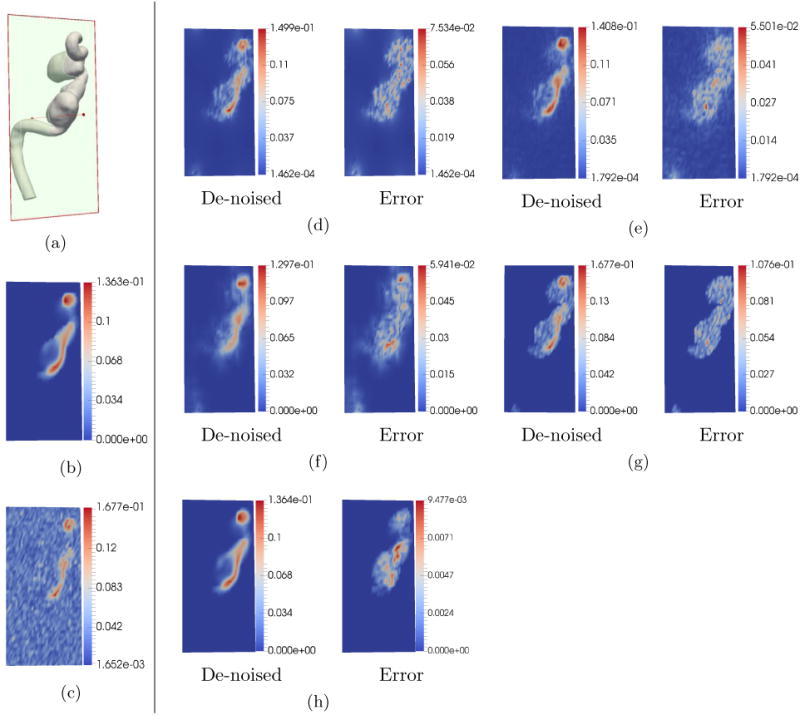
Figure 5.

De-noising comparison on simulated data with high noise and low 4D Flow MRI grid resolution. The units of the color bar are in m/s. In this test, the noise standard deviation was set to be σ = 50%|Vmax |. The 4D Flow MRI grid resolution was set to 21 × 51 × 25 voxels which is the same for in-vivo 4D Flow MRI. (a) 2D section at which velocity magnitudes were sampled. (b) Down-sampled ground truth. (c) Simulated noisy 4D Flow MRI. (d) De-noising using FDM. (e) De-noising using RBF. (f) De-noising using DFW-sm. (g) Reconstruction using DFW-sms. (h) De-noising using POD. Clearly, as can be seen in the figure, POD method is able to preserve details in the flow much better than all other methods.
