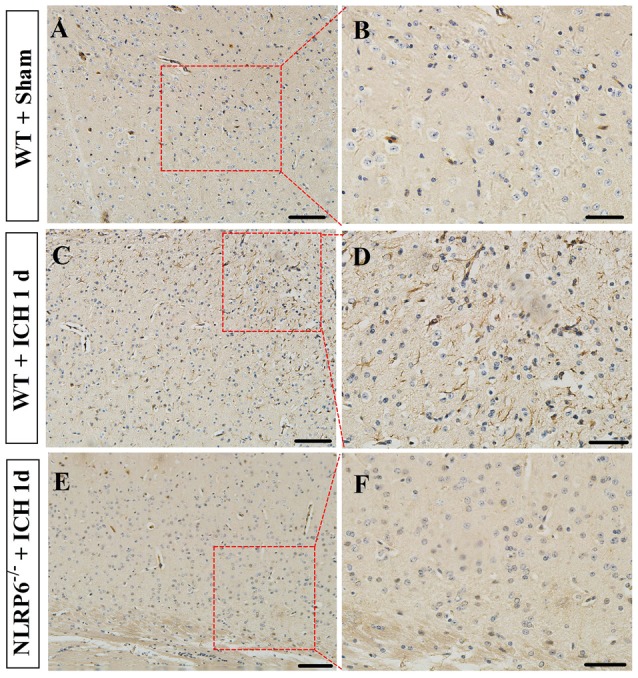
Figure 2.

Immunohistochemical staining for NLRP6. (A,B) Representative images of NLRP6 immunostaining in the brain tissues in the Sham groups. (C,D) Representative images of NLRP6 immunostaining in the perihematomal brain tissues at 1 day after ICH. (E,F) Representative images of NLRP6 immunostaining in the brain tissues in the NLRP6−/− mice at 1 day after ICH. n = 4 per group, scale bars = 100 μm (A,C,E), scale bars = 50 μm (B,D,F).
