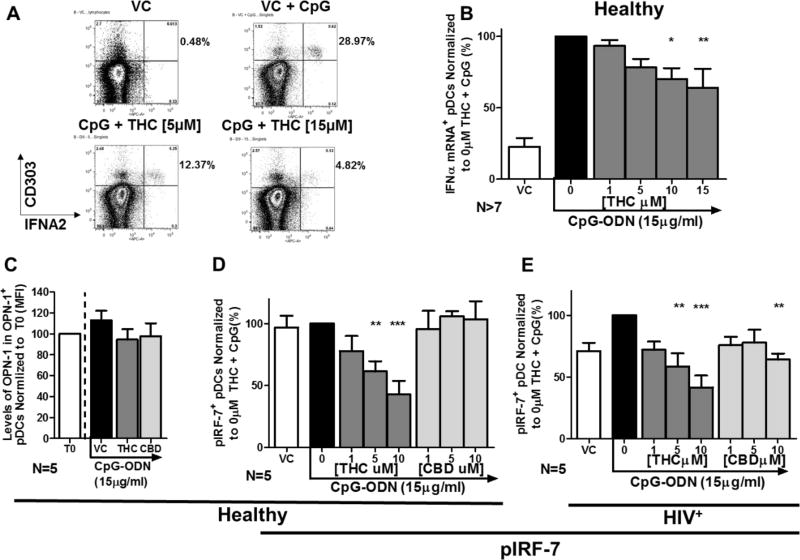
Figure 4. IFNΑ2 expression and phosphorylation of IRF-7 (pIRF-7) are suppressed by THC in pDC from both healthy and HIV+ donors.
PBMCs were treated with THC at 1, 5, 10, 15 µM for 30 min and then stimulated with CpG-ODN for 5 hrs. IFNΑ2 gene expression was determined using PrimeFlow RNA assay by Affymetrix. pDCs were identified as CD303+/123+ cells. A) FACS scatter plot pDCs undergoing CpG-ODN induced upregulation of IFNΑ2 expression in pDCs and concentration dependent suppression by THC. B) pDC IFNΑ2 gene expression normalized to VC + CpG-ODN across multiple donors (VC & 0 µM: N=9; 1 & 5µM: N=8; 10 & 15µM: N=7). Asterisks indicate statistically significant differences (P<0.05) in IFNΑ2 expressing pDCs compared to 0 THC with CpG group (1-Way ANOVA with Dunnett’s posttest). Levels of Opteopontin (OPN) and pIRF-7+ pDCs were determined by flow cytometric analysis. pDCs were identified as CD303+/123+ cells. C) Osteopontin (OPN) levels in pDCs treated with THC and CBD at 10µM (N=5). D) Percent pIRF-7+ pDC in from healthy donors (N=5). E) Percent pIRF-7+ pDC from HIV+ donors (N=5). Asterisks indicate statistically significant differences in pIRF-7 expressing pDCs compared to the 0 THC + CpG group (1-Way ANOVA with Dunnett’s posttest).

