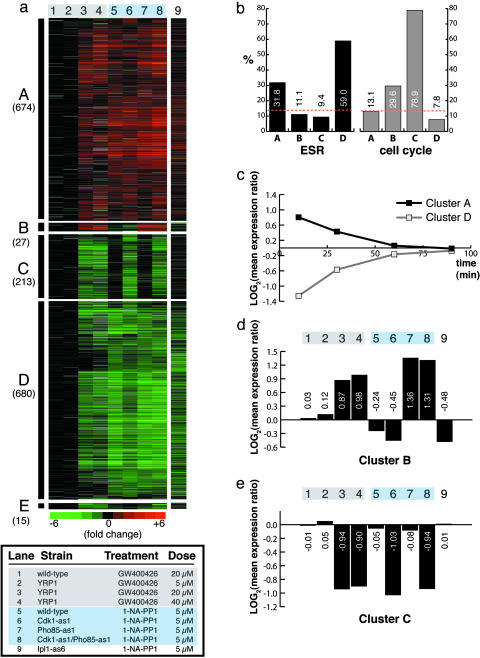
Fig. 2.
Hierarchical clustering of microarray data identifies gene expression clusters resulting from kinase inhibition. (a) Five robust clusters of genes (A–E) identified by hierarchical clustering of microarray expression data (lanes 1–8). Yeast cells were treated for 10 min. Log expression ratios for drug treatments compared with a DMSO control are shown. Each data point represents the geometric mean from two microarray experiments. Gray indicates incomplete data. Lane 9 shows data from genes in clusters A–E garnered from a 30-min treatment of Ipl1-as6 cells with 1-NA-PP1. (b) Percentage of genes within each cluster that are known to be cell-cycle-regulated or change in expression as part of the ESR. Orange dotted lines indicate the percentage of genes in the yeast genome that are involved in either process. Clusters A and D are enriched in induced and repressed ESR genes, respectively, demonstrating that these clusters correspond to the nonspecific yeast multidrug resistance response. Cluster C, corresponding to inhibition of Cdk1, is heavily enriched in cell-cycle-regulated genes. (c) Microarray data from a time course of WT cells treated with 5 μM of 1-NM-PP1. The log mean expression ratios for genes in cluster A or D are plotted at each time point. (d) Quantification of mean expression ratios from cluster B in a. (e) Quantification of mean expression ratios from cluster C in a.

