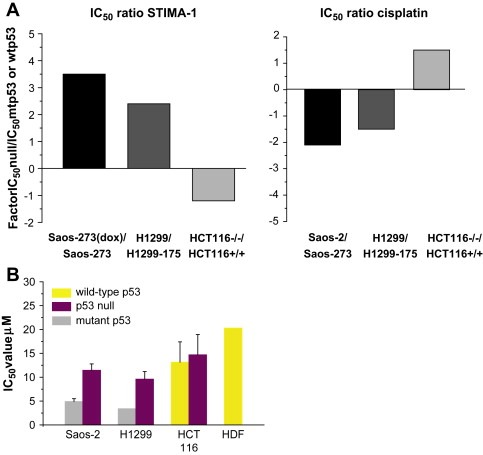
Figure 5.

The effect of STIMA‐1 and cisplatin in cells with different p53 status. (A) Diagram showing the ratio between the IC50 values for the mutant p53‐expressing cells/wild type p53 expressing cells and the IC50 values for corresponding p53 null cells. While the Saos‐2‐His273 cells and H1299‐His175 cells are more sensitive to STIMA‐1 treatment, indicating growth suppression in a mutant p53 dependent manner, the wild type p53‐carrying HCT116 cells are more sensitive to cisplatin treatment. (B) IC50 values as determined by the WST‐1 proliferation assay. The mutant p53‐expressing H1299‐His175 and Saos‐2‐His273 cells are more sensitive to STIMA‐1 treatment than their p53 null counterparts and HCT116 p53+/+ and HCT116 p53−/− cells. Human diploid fibroblasts showed the lowest sensitivity to STIMA‐1 treatment. Data represent mean±standard error (n=2).
