
Figure 1.
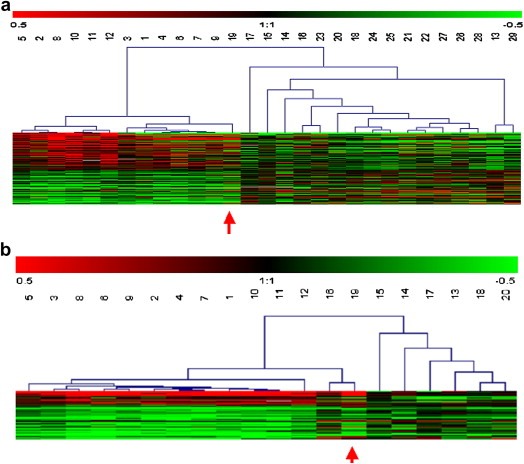
Supervised hierarchical clustering of stage 4 NB comparing: (a) stage 4S NB to non‐stage 4S NB (124 significant genes), (b) stage 4S to [1yr−] stage 4 NB (45 significant genes). Each row represents a single gene and each column a tumor. Tumors #: 1–12, 4S; 13–20, [1yr−]; 21–29, [1yr+]. As shown in the color bar, red and green indicate up and down expressions, respectively, black no change, and gray no data available. Red arrow points #19 [1yr−] stage 4 NB tumor with a 4S’ profile suggesting an atypical stage 4S clinical presentation.