
Figure 2.
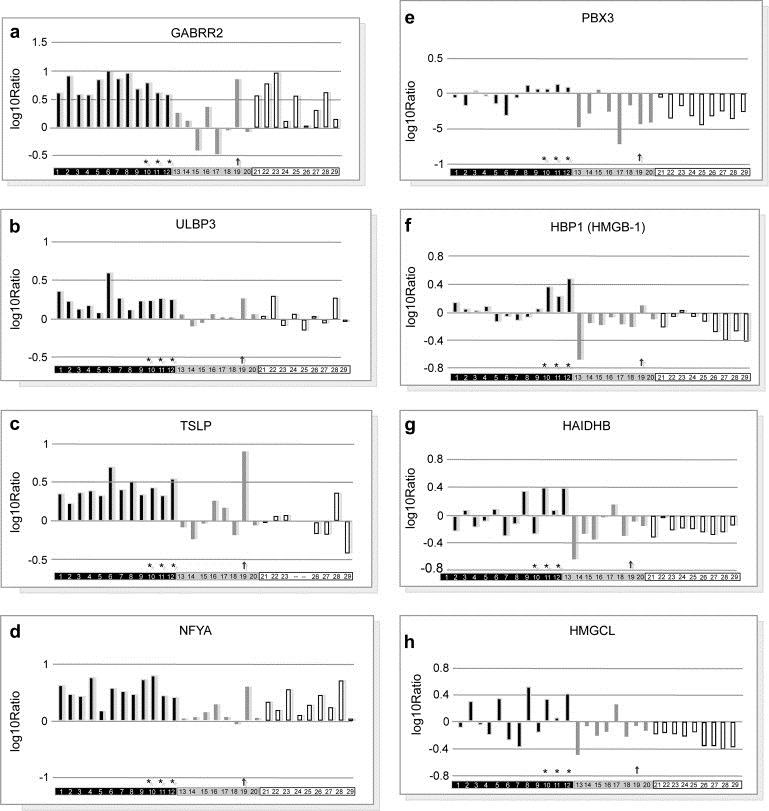
Expression profiling of top genes selected using gene classifier and S.B.I.M.E. analysis in each individual tumor of the patients cohort. For a given gene, the value of each individual bar of histogram represents the log ratio of the tumor expression signal as compared to that of the pool. Student's test yielded 2 p values, respectively 4s vs non‐4s and 4s vs [1yr−], as indicated in brackets. Tumors #: 1–12, 4S (blue bars); 13–20, [1yr−] (yellow bars); 21–29, [1yr+] (hatched bars). # 10, 11 & 12 tumors are in regression (*). Red arrow points #19 [1yr−] stage 4 NB tumor. a: GABRR2 [7 10−4; 10−4], b: ULBP3 [4 10−4; 3 10−3]; c: TSLP1[3 10−4; 1.5 10−2]; d: NFYA [9 10−4; 3 10−4]; e: PBX3 [4 10−5; 6 10−4]; f: HBP1 [4 10−4; 7 10−3]; g: HADHB [9 10−3; 7 10−2]; h: HMGCL [4 10−3; 10−1].