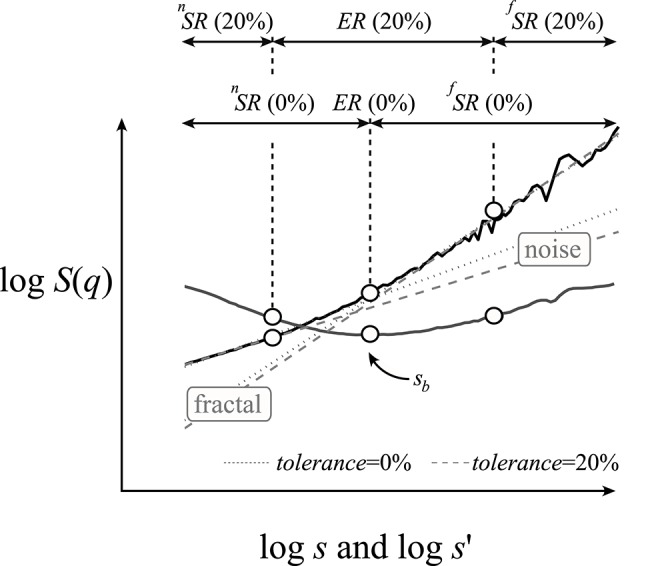
Figure 3.

Numerical demonstration of the moment-wise scaling range adaptivity method. A bimodal, multifractal structure–function profile at q = 2 (solid black) was synthesized by DHM as the sum of fractal (Htrue = 1.25) and noise (Htrue = 0.5) signals with commensurable standard deviations. Regression slopes were determined by the DFA algorithm. The SSE(q,s′) function (solid gray line) at q = 2 is derived from Equation (3). The qSRA method finds the breakpoint (sb) at the minimum of this function. The exclusion range (ER, shown at a tolerance level of 20%) spans across scales where SSE(q,s′) < SSEtolerance as calculated by Equation (5). In turn, the boundaries of the ER are set to the low and high edges of the adjacent scaling ranges for the underlying fractal and noise components, respectively. If tolerance = 0, then the ER is not excluded from the regression analysis (gray dashed regression lines). When tolerance = 0.2 (gray dotted regression lines), the estimated slopes better represent those of the underlying fractals. Other methods (such as, SSC) yielded isomorphic results (not shown).
