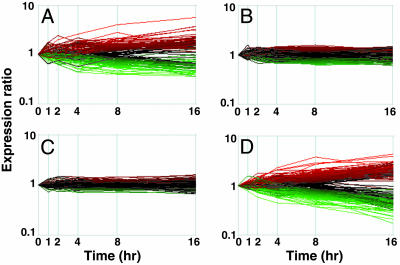
Fig. 3.
Gene expression profiles of SAHA- and depsipeptide-selective genes. Genes identified as selectively regulated by SAHA (n = 150) (A) or depsipeptide (n = 364) (D) are shown, with their corresponding expression in response to the other HDACis shown in C and B, respectively. Up-regulated genes are depicted in red, down-regulated genes are depicted in green, and each line corresponds to a single gene. Genes were considered to be selectively regulated by SAHA if they (i), were significant for SAHA; (ii), were not significant for depsipeptide; and (iii), showed a significant difference in response to SAHA relative to depsipeptide. The third condition was also tested by using an F statistic and was used to eliminate genes that responded similarly to the two compounds but narrowly failed to reach significance for one. The reverse criterion was used to select genes specifically regulated by depsipeptide.

