
Figure 2. Identification of protein complexes and communities in the cellular extracts.
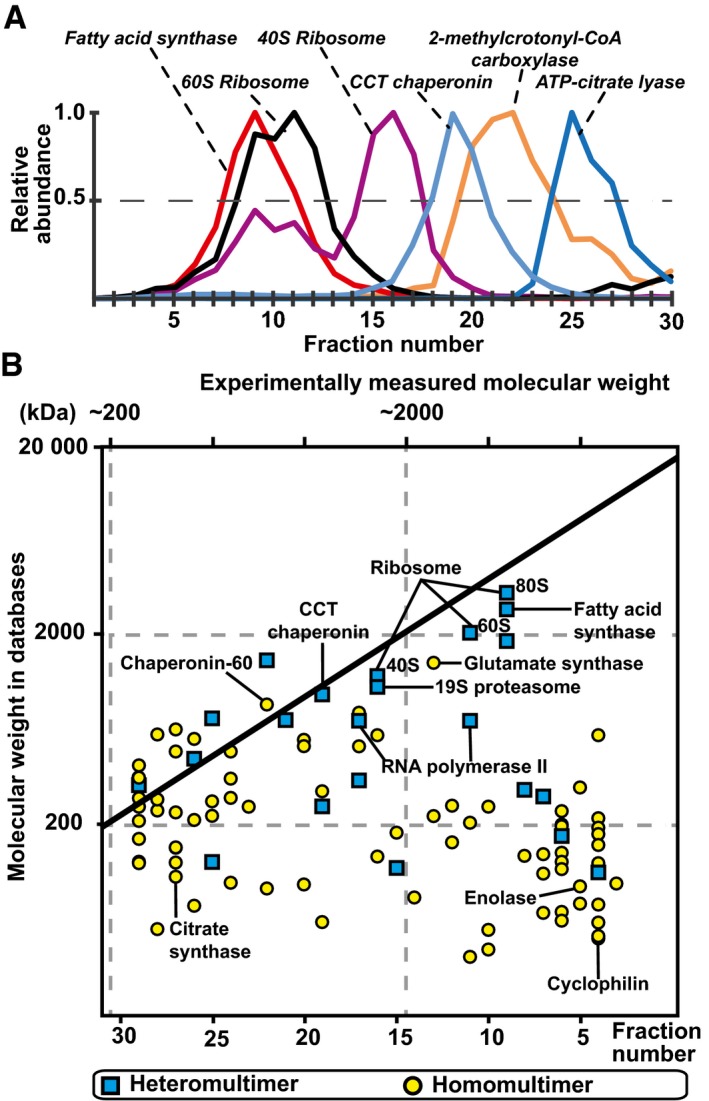
- Elution of selected protein complexes as a function of their retention times (see Appendix Fig S4 for their corresponding subunit elutions).
- Scatter plot indicating discrepancies in the expected and measured molecular weights of 102 protein complexes that elute as a single peak; 50% of protein complexes are observed to have higher molecular weights than structurally characterized, indicating that they are organized in higher‐order assemblies.