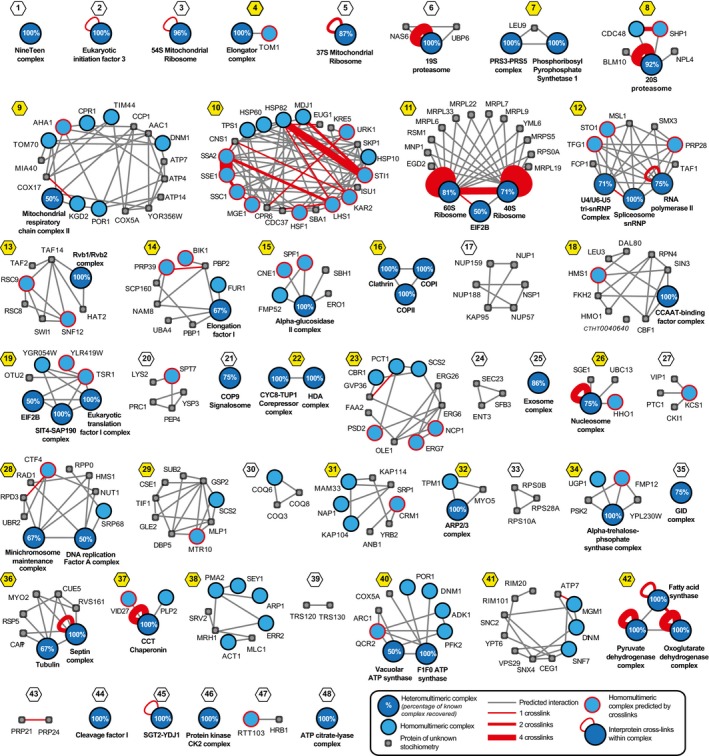
Integration of experimental elution data, known functional associations, and predicted interaction interfaces from homologous proteins allow the creation of a high‐quality network with interconnected protein complexes (
Appendix Figs S8–S10). Here, known protein complexes are shown in blue and other physically associated proteins in gray, predicted interactions of complexes as gray lines and cross‐links as red lines, and cross‐links between different subunits of a heteromultimeric complex are represented with red loops (see insert). Communities containing multiple complexes are highlighted with yellow; numbering and naming of complexes and communities are described in the legend of
Appendix Fig S9.