
Figure 4. Higher‐order assemblies identified by proteome‐wide cross‐linking mass spectrometry, biomolecular modeling, and negative‐stain electron microscopy.
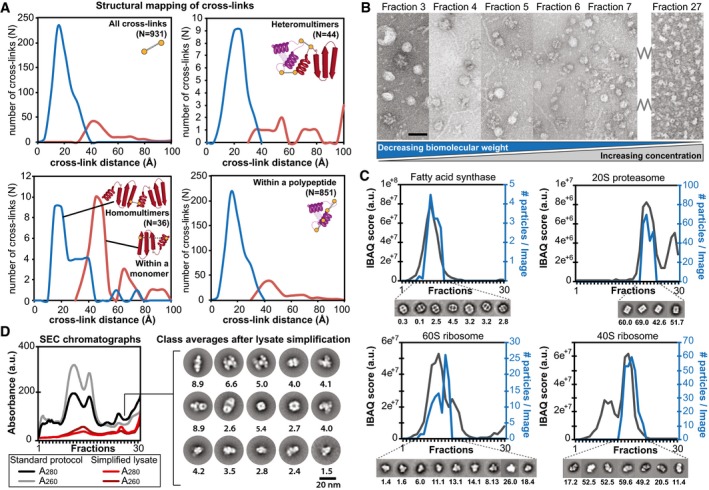
- Distance distributions of identified cross‐links on top of the modeled protein complexes and identification of novel interactions. Satisfied distances are shown in blue and over‐length cross‐links are shown in red.
- Negatively stained electron micrographs of fractions 3–7 and 27 directly derived from size exclusion chromatography showing the structural signatures and their structural integrity within the fractions. Decreasing molecular weight correlates with increased protein concentration as a function of protein complex elution is highlighted. Scale bar: 60 nm.
- Abundance profiles as determined by quantitative mass spectrometry correlate with the number of observed single particles of the corresponding structural signature within the negative‐staining electron micrographs; shown for fatty acid synthase, 20S proteasome, 60S and 40S ribosome (the number of particles per image per fraction is indicated below the class averages).
- Simplification of lysate (collecting only the flow‐through from anion exchange chromatography) prior to SEC separation allows class averaging of structural signatures from complex fractions that were previously too low abundant. The number of particles per image per fraction is indicated below the class averages.