
Figure 5. Visualization of transient interactions in fatty acid synthesis.
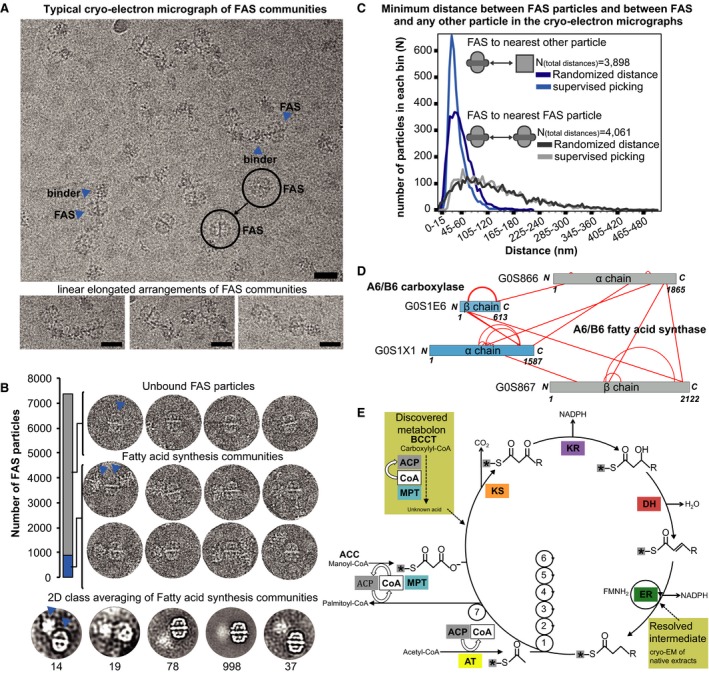
- Communities in fatty acid metabolism and the quantification of intra‐community distances within cryo‐electron micrographs. Fatty acid synthase (FAS) frequently interacts with other sizeable protein complexes in a linear “pearl‐string‐like” arrangement and usually localizes at the edges of the community. Scale bars correspond to 25 nm. FAS particles (circles) and their nearest neighbors (arrow heads) are indicated.
- Additional density outside of the ctFAS dome is observed in ∼10% of the single particles; 2D class averages shown at the bottom. The arrow heads show typical assemblies within the pool of particles. In 90% of all cases, isolated FAS particles are seen (unbound state). In the remaining 10%, higher‐order protein assemblies comprised of FAS particles and high molecular weight binders are seen (bound state).
- Related to (A). Calculation of minimum distances between pairs of FAS molecules as well as FAS molecules and their closest non‐FAS neighbors in comparison with random distributions. Whereas FAS molecules are randomly distributed, their binders are not, confirming physical interactions. Supervised picking means that all single particles were manually picked from the images. Randomized distance means that these manually picked particles were assigned random coordinates in each image (randomization of x, y coordinates considering image borders) and then their distance is calculated.
- Cross‐linking mass spectrometry data show that the binder is a carboxylase that is bound to the malonyl transacylase domain and acyl carrier protein (ACP) is in the vicinity, considering cross‐link length and the positions of the lysine on the ctFAS structure. Cross‐links come from both affinity‐purified and fractionated cell extracts.
- The molecular mechanisms in fatty acid synthesis (Wakil et al, 1983), and the relevance of the position of the ACP (see Fig 6 for details) and carboxylase to the catalytic cycle is indicated (see text). ACP, acyl carrier protein; CoA, acetyl‐coenzyme A; MPT, malonyl/palmitoyl transferase; KS, ketoacyl synthase; KR, ketoacyl reductase; DH, dehydratase; ER, enoyl reductase; AT, acetyltransferase. Asterisks represent the acyl carrier protein (ACP).