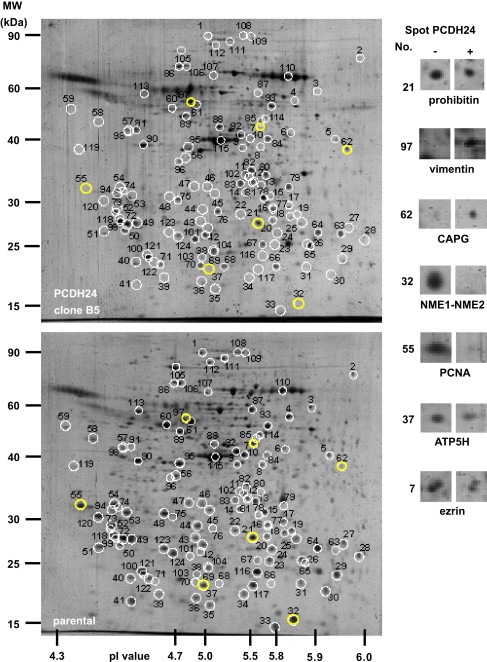
Figure 2.

Representative 2‐DE images of total proteins extracted from parental (lower panel) and PCDH24‐expressing HCT116 cells (upper panel). The magnified views of representative up‐ and down‐regulated protein spots (yellow circles in the left) are also indicated (right). Similar results were obtained from three independent experiments with each clone.
