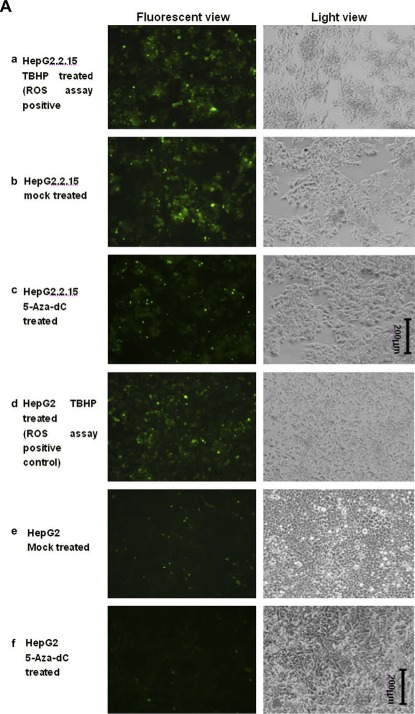
Figure 5.

ROS assay detecting the ROS levels in HepG2.2.15 and HBx transiently transfected HepG2 cells. A. ROS levels in HepG2 and HepG2.2.15 cell lines. Fluorescent view (Left panel) was presented, as well as the light view (right panel) serving as cell density control. a) HepG2.2.15 treated by TBHP which serves as the assay positive control for the successful induction of ROS; b) HepG2.2.15 mock treated by only DMSO in the same volume as that of 5‐Aza‐dC in c); c) HepG2.2.15 treated by 5‐Aza‐dC; d) HepG2 treated by TBHP as the assay positive control; e) HepG2 mock treated by only DMSO; f) HepG2 treated by 5‐Aza‐dC. B. ROS levels in HepG2 cells transfected by HBx A‐D. HepG2 cells transfected by the empty vector pXj40 were also included as the negative controls.
