
Figure 6.
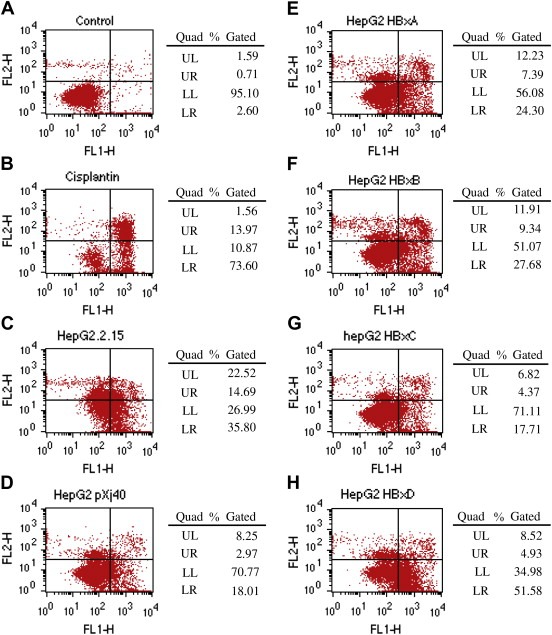
Flow cytometry analysis of apoptosis in HepG2.2.15 and HBx transfected HepG2 cells. FL1‐H indicates the Annexin result while FL2‐H indicates the PI staining result. Therefore, LL (lower left) gives the normal (living) cells with low Annexin and low PI staining and LR (lower right) gives the apoptotic cells with high Annexin and low PI staining, while UR (upper right) shows the necrotic cells with high Annexin and high PI staining. Experiments were carried out three times with one typical set of results shown. A. HepG2 cells without treatment served as negative control and were used to get the analysis settings. B. HepG2 cells treated with Cisplatin were used as the apoptosis positive control. C. HepG2.2.15 cells. D–H. HepG2 cells transfected with either empty vector pXj40 or pXj40‐HBx A/D.