Figure 5.

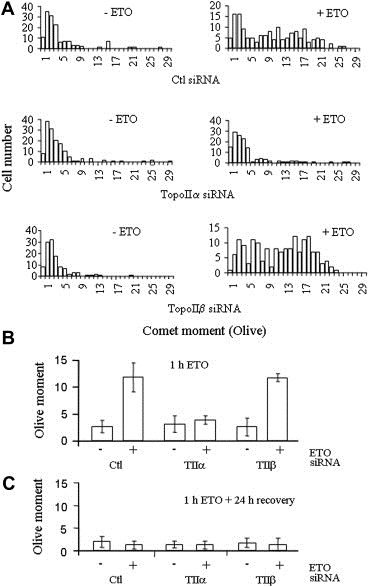
Comet analysis of etoposide‐induced HeLa cell DNA damage. Single cell electrophoresis and SYBR Green I analysis of cells treated as in Figure 3. Quantification of 100–150 cells per condition. (A) Distribution profile of the comet moments. Comets were grouped in ascending order of comet moment values (rounded up to the nearest integer). (B) Comet results expressed as the average of the moment means from two independent experiments (±SD). Wilcoxon Two Sample test indicates only the comet moment between Ctl or topoIIβ siRNA‐treated cells exposed to etoposide is significantly different from that of topoIIα‐treated cells exposed to etoposide (P<1.5×10⁻¹²). (C) Average of the moment means of cells maintained in etoposide‐free medium for 24h following 1h treatment with DMSO±25μM etoposide.
