Figure 7.

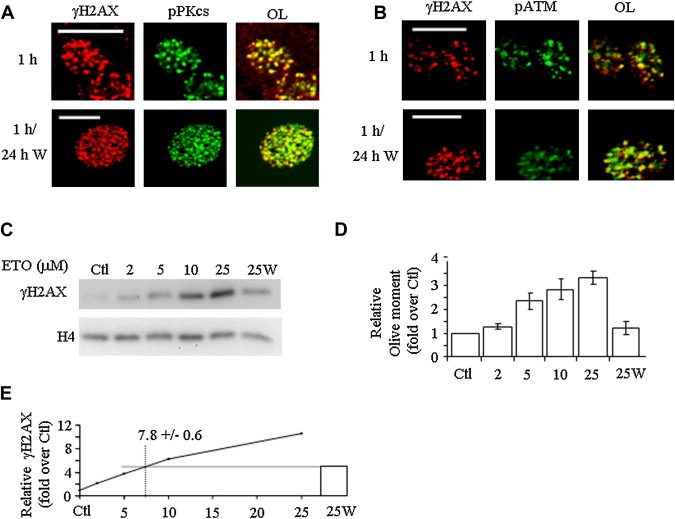
Persistence of the damage response. Co‐localization (OL, yellow) of γH2AX (red) with pDNA‐PKcs (A, green) and pATM (B, green) either 0h or 24h following withdrawal of etoposide. Scale bar=20μm. Channel intensities were optimized to facilitate overlay visualization and do not reflect absolute emission intensities (see Supplementary Figure 4 for absolute intensities). (C) Left, γH2AX levels following 1h treatment with 2–25μM etoposide (lanes 2–5) and following 24h withdrawal from 25μM treatment (25W), with H4 levels shown as loading control. (D) Average of olive moment means in comets of cells treated as in (C). (E) Quantification of γH2AX corrected for loading with the concentration of etoposide, with interpolation from a linear regression fit of the 1–10μM concentration used to predict the concentration of etoposide needed in a 1h treatment (7.8μM) to provide a γH2AX response equal to that which remained following 24h withdrawal. Error bars represent the average of two independent experiments (±SD).
