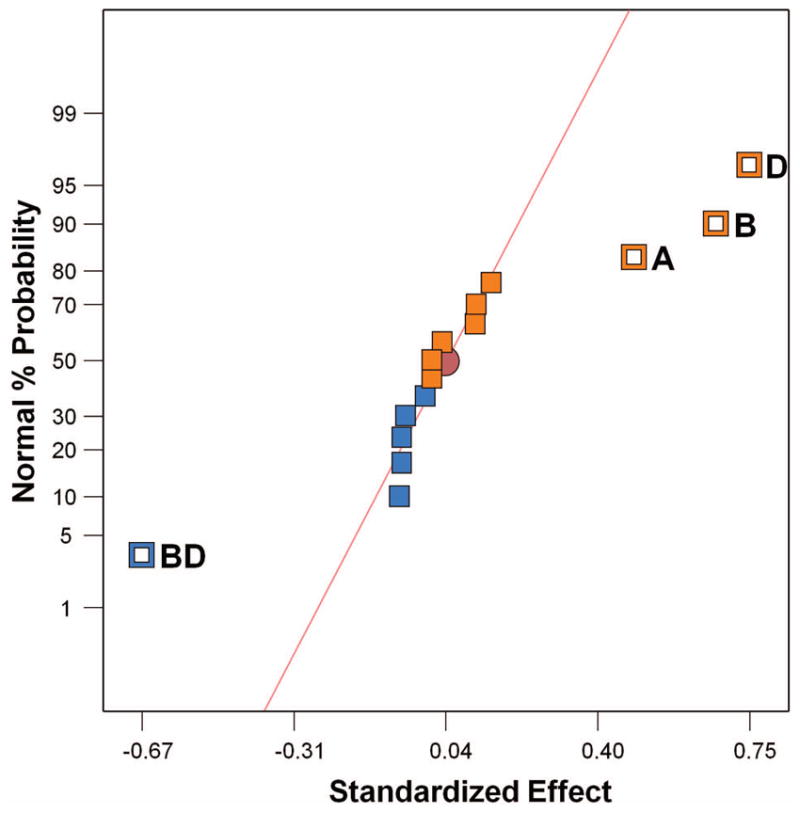
FIGURE 2.

Normal probability plot of the effects of the factors and their interactions. Effect of single factors is represented by A, B, C, D, E; their interactions with other variables are represented as AB, BC, etc. In this figure, A- Cys; B- pH; D- EDC; BD- two factorial interaction of pH and EDC.
 represents positive effects; while
 represents negative effects. The model is framed based on selecting the dominant factors that are highlighted and labeled in plots; other factors are considered as errors.
