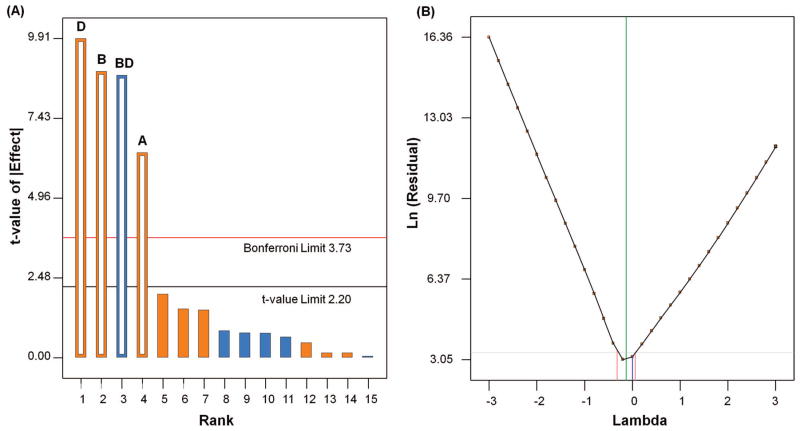
FIGURE 3.
(a) Pareto chart representing the effect of each factor over response variable in the descending order from greatest to lowest contribution for FF design. Bonferroni limit is the threshold where the effect emerging above this limit are significant. T limit is the threshold where the effect emerging above this but below Bonferroni limit may possibly be significant. Effects D, B, BD, A are significant. b) Box-Cox plot of power transforms representing the required transformation of data for FF design. In this figure,
 represents lambda current = 0;
 is best lambda current = −0.13; recommeded transform is Log transformation with lambda = 0.

