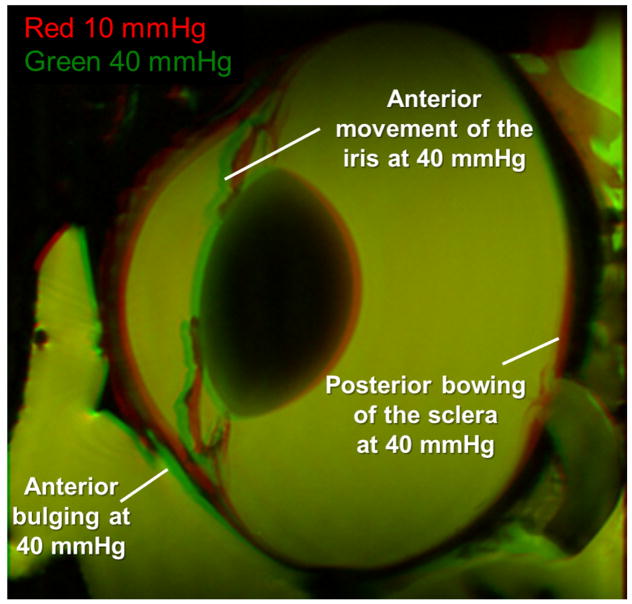
Figure 4.
Differences between an eye at 10 and 40 mmHg. The 10 mmHg image is colored in red and the 40 mmHg image is colored in green. At 40 mmHg the iris, cornea, and anterior sclera move anteriorly as indicated by the green regions noted on the figure. The posterior sclera bulges posteriorly at 40 mmHg as indicated by the red region corresponding to the 10 mmHg condition indicated on the figure.

