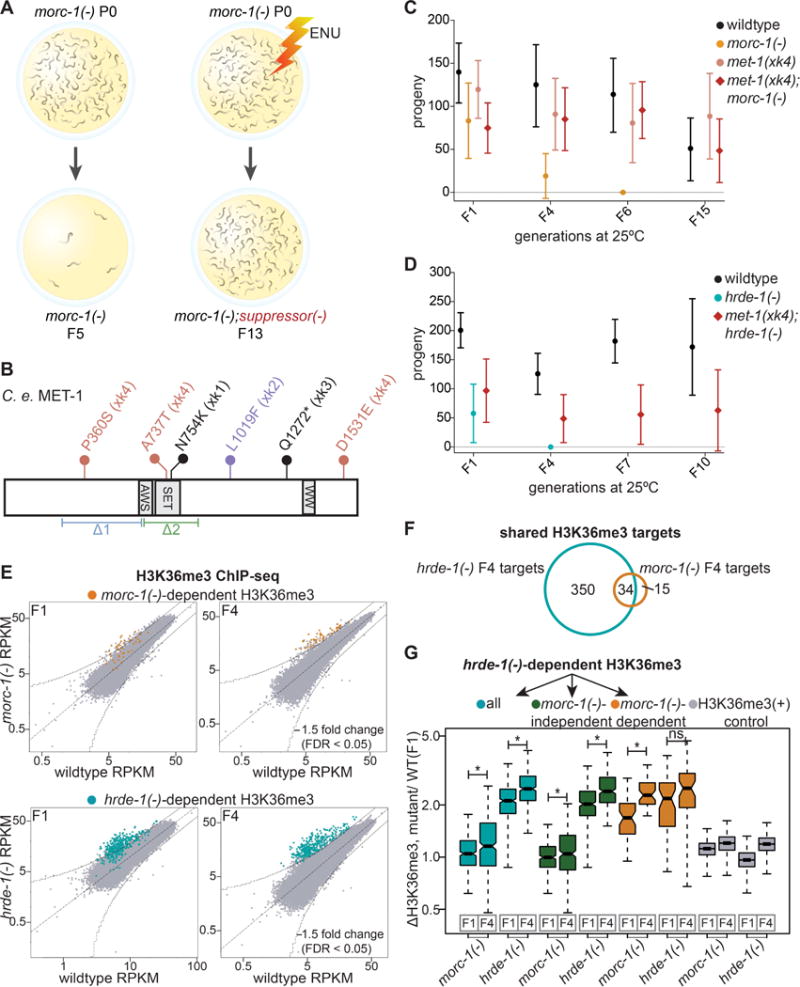
Figure 5. Mutations in met-1 suppress morc-1(−) germline mortality. (A).

Overview of forward genetic screen to identify morc-1 suppressors. (B) Schematic of C. elegans MET-1 (isoform b). Flags indicate the alleles generated by our screen (xk1-4). The xk4 allele contains three missense mutations. Indicated below are the pre-existing deletion alleles, n4337(Δ1), and ok2172(Δ2). (C) met-1(xk4) rescues morc-1(−) and (D) hrde-1(−) germline mortality. Mean fertility ± SD is plotted for each genetic background at each generation (n=16). For brood size of individual worms in these experiments, see Figures S4B and S4C. (E) RPKM of 1 kb windows in wildtype (x-axis) vs. mutant (y-axis) H3K36me3 ChIP libraries in F1 and F4 generations. Indicated in yellow and blue are 1 kb regions >1.5-fold-enriched in F4 morc-1(−) and hrde-1(−) respectively with FDR of <0.05 in two biological replicates. (F) Overlap of morc-1(−) and hrde-1(−)-dependent H3K36me3 regions. (G) Box plot representing the ratio of H3K36me3 levels in the indicated mutant vs. F1 wildtype. hrde-1(−)-dependent regions (blue) show significant increase in H3K36me3 from F1 to F4 in both morc-1(−) (p=3.07×10⁻⁷, Welch’s t-test) and hrde-1(−) (p<2.2×10⁻¹⁶, Welch’s t-test) mutants. hrde-1(−)-dependent, morc-1(−)-independent regions (green) show significant increase in H3K36me3 from F1 to F4 in hrde-1(−) (p<2.2×10⁻¹⁶, Welch’s t-test) and morc-1(−) mutants (p=0.0012, Welch’s t-test). hrde-1(−)-dependent, morc-1(−)-dependent regions (yellow) are significantly more enriched in morc-1(−) F4 vs. morc-1(−) F1 (p=6.44×10⁻¹¹, Welch’s t-test) but not significantly different in hrde-1(−) F1 vs. F4 (p=0.011, Welch’s t-test). Gray boxes show H3K36me3 levels regions with high H3K36me3 in F1 wildtype. See also Figures S4, S5, and S6.
