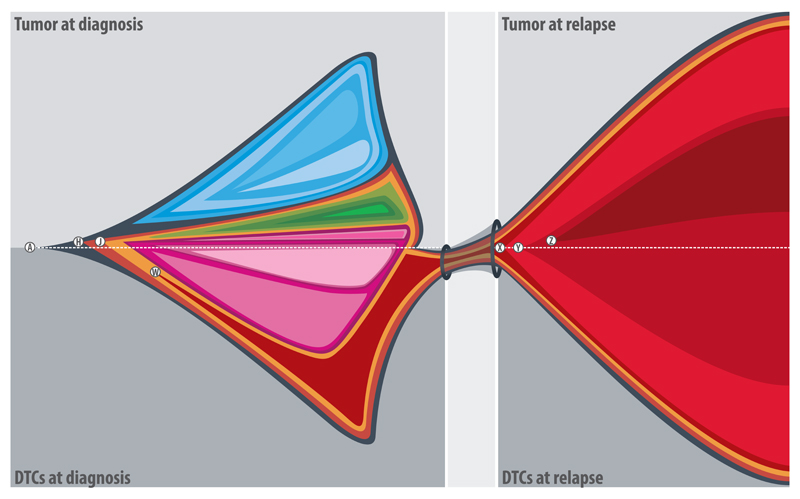
Figure 1.
Graphical representation of clonal expansion in a stage 4 neuroblastoma patient. Each quadrant represents the clonal architecture of a tissue/time point. Each color represents a group of chromosomal aberrations and the size of each colored area represents the proportion of cells with these aberrations within the analyzed samples (the detail of subclonal frequencies of different aberrations is provided in the supplementary table S3). The primary tumor displayed a branched clonal evolution leading to extensive intra-tumor heterogeneity. A 1q terminal deletion (W) which was present in the diagnostic DTCs and also in the both DTCs and metastatic tumor at relapse was not detected in any of the primary tumor samples. Certain chromosomal aberrations were acquired independently in geographically different tissues at diagnosis and at relapse, indicating parallel tumor progression. A: 18 breakpoints corresponding to 13 aberrations including ATRX deletion (exons: 2-8) present homogenously in all samples/time points; H: Chromosome Y loss and J: 1p33(49,772-49,927)×3 (affecting AGBL4 gene) are present homogenously in the DTCs at diagnosis and relapse samples and heterogeneously in the tumor at diagnosis; W: 1q42.2qter(231,262-249,250)×1 is present heterogeneously in the DTCs at diagnosis and homogenously in the relapse samples; X: 21 breakpoints corresponding to 13 aberrations (including 19q and PTPRD deletions) are homogenously present in the relapse samples; Y: duplication of chromosome 17 is heterogeneously present in the relapse samples; and Z: 5pterp15.2(1-12,709)×1 is heterogeneously present only in the metastatic tumor at relapse. Breakpoints are given in kb. The areas with blue, green and pink spectrums represent different groups of aberrations heterogeneously present in the tumor and DTCs at diagnosis (Supplementary Table S3).

