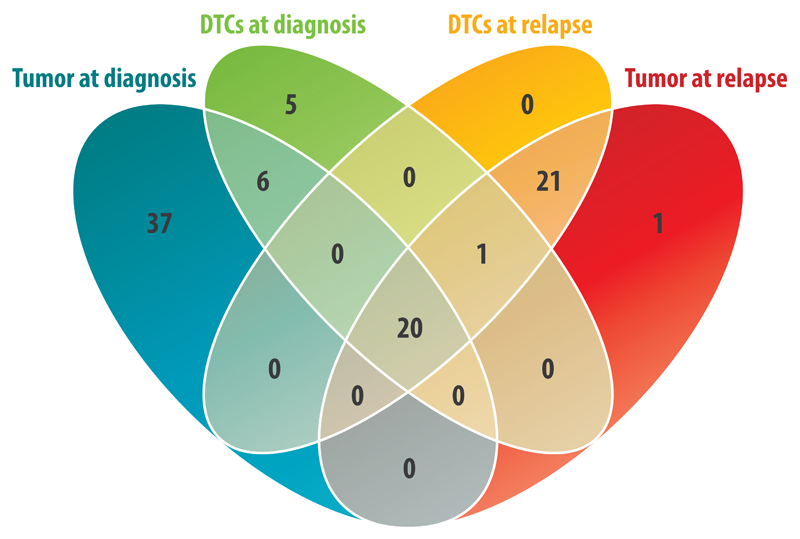
Figure 2.
Venn diagram representing the number of breakpoints detected either homogenously or heterogeneously in different samples of one patient. Besides aberrations unique to certain tissues and time points, 20 breakpoints were shared between all samples consist of 18 breakpoints homogeneously present in all samples, representing the genomic profile of the common ancestor clone, and two breakpoints present homogenously in the diagnostic DTCs and relapse samples and heterogeneously in the primary tumor.

