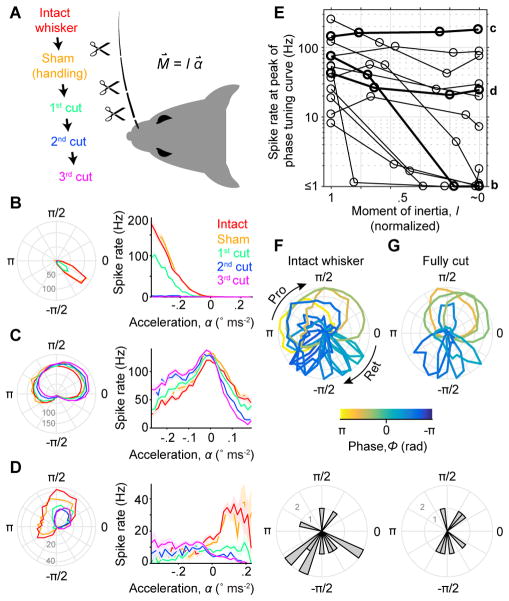
Figure 6. Self-motion responses arise from both external and internal stresses.
(A) Schematic of the experiment. Responses during whisking in air were recorded across progressive cuts to shorten the relevant whisker and decrease its moment of inertia, I (resistance to change in angular motion). Bending moment at the base of the whisker (M⇀), proportional to I and angular acceleration (α⇀), was thus progressively reduced. As a control, prior to cutting the whisker was it was handled in a sham manipulation. (B) Tuning curves for phase (left) and acceleration (right; ± SEM) are shown for an example SA afferent across cutting conditions (colors, as in A). Afferent showed gradual reduction of spike rates down to zero as the whisker was progressively cut to its base (i.e. when I ~ 0). Note that preferred phase remained constant as overall spike rate decreased. (C) Example SA afferent with little change in responses after progressive cutting even in the “fully cut” condition. Conventions as in (B). (D) Example SA afferent with response that were reduced but not eliminated by cutting. Conventions as in (B). (E) Summary showing spike rate at the preferred phase for each afferent (n = 13 SA), as a function of the remaining whisker moment of inertia (normalized to intact condition). Examples from (B–D) are plotted with thick lines and indicated at right by corresponding lower case letters (b,c,d). A log scale for the spike rate axis accommodates the wide range across afferents. (F) Overlay of normalized phase tuning curves (top) and histogram of preferred phases (bottom) for each afferent (n = 13 SA) from the intact whisker condition. Conventions as in Figure 5D–E. (G) As in (F) but for fully cut whisker conditions (n = 7; only neurons with ≥ 3 Hz peak response). See also Video S2.

