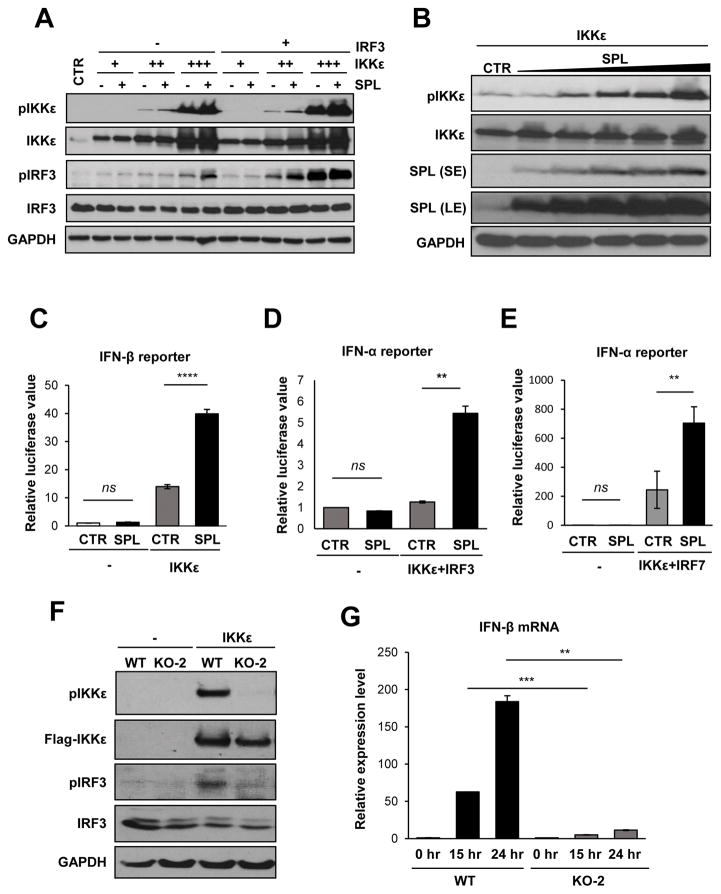
Figure 4. SPL increases IKKε activation to enhance IKKε-mediated IFN induction.
(A) 293T cells (2 X 10⁵) were transfected with increasing doses of IKKε expression plasmid (5, 25, or 125 ng) in the presence of 200 ng of IRF3 plasmid or empty vector control plasmid (-) in the presence of 200 ng of SPL plasmid or the empty vector control plasmid (-), as indicated. After 10 hr, cells were harvested and Western blotting was performed to detect pIKKε, IKKε, pIRF3, IRF3, and GAPDH. (B) 293T cells (1 X 10⁶) were transfected with 25 ng of IKKε with increasing doses of SPL plasmid (0.2, 0.4, 0.6, 0.8, or 1 μg). Ten hr later, Western blot analysis was performed to detect pIKKε, IKKε, SPL, or GAPDH. Both the short exposure (SE) and long exposure (LE) blots of SPL are provided as indicated. (C) 293T cells were transfected with 50 ng of IFN-β reporter plasmid along with 10 ng of IKKε plasmid in the presence of SPL or empty vector (CTR). At 1 day post-transfection, luciferase assay was performed. (D and E) 293T cells were transfected with 100 ng of IFN-α1 reporter plasmid along with 10 ng of IKKε and IRF3 (D) in the presence of 250 ng of SPL or empty vector control (CTR). In (E), IRF7 was used instead of IRF3. At 1 day post-transfection, cells were harvested and luciferase assay was performed. Relative luciferase values are shown. Values represent mean ± SEM (n = 3/group; **, P ≤ 0.01; ****, P ≤ 0.0001; ns = not significant). (F) WT 293T cells or SPL KO-2 cells (2 X 10⁵) were transfected with 50 ng of IKKε expression plasmid or empty vector control plasmid (-). Thirty two hours later, Western blot analysis was performed to detect pIKKε, IKKε, pIRF3, IRF3, and GAPDH. (G) WT 293T cells or SPL KO-2 cells (2 X 10⁵) were transfected with 50 ng of IKKε expression plasmid or empty vector control plasmid (0 hr). Twenty four hours later, relative mRNA levels of IFN-β were determined by performing qPCR. Results are plotted as fold induction of IFN-β in WT and KO-2 samples over the value from each samples transfected with empty vector control plasmid (0 hr). Values represent mean ± SEM (n = 3/group; **, P ≤ 0.01; ***, P ≤ 0.001).

