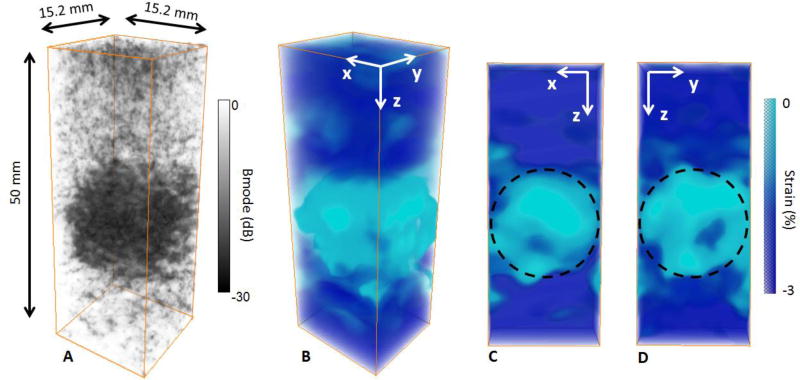
figure 4.
3-D B-mode volume (A), 3-D axial strain volume (B) and slices of the strain volume (C,D) of the stiff inclusion embedded in the soft phantom. The inclusion was distinguishable on the B-mode volume due to the different concentration of scatterers (A). The inclusion was also distinguishable on the 3-D axial strain volume (B), absolute axial strain was low for the stiff inclusion whereas it was high for the soft layer. Slices of the 3-D strain volume were displayed in x-z plane (C) and in x-y plane (D) with the ROI.

