
Figure 3. Lessons from Akt2 and Akt3.
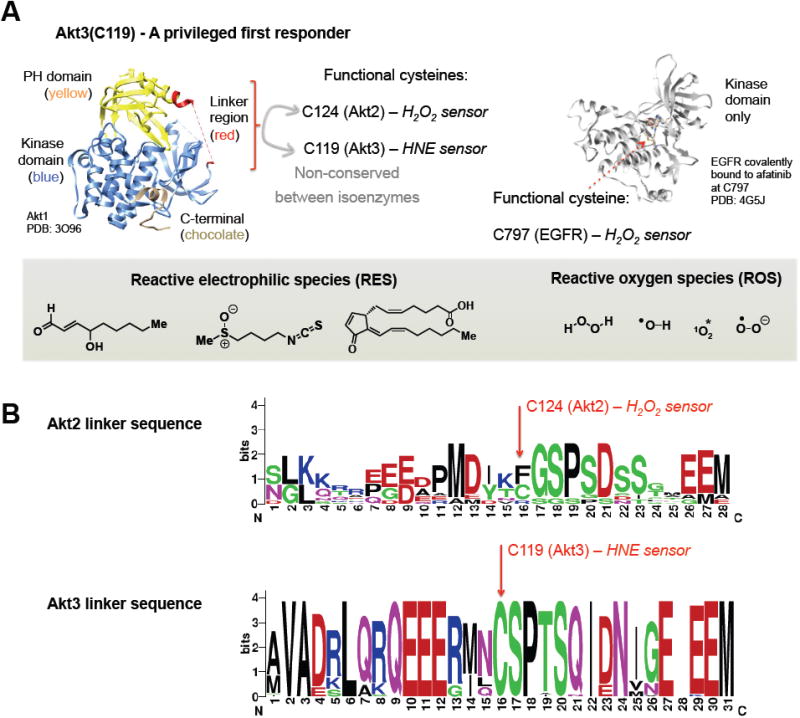
(A) (Left) X-ray crystallographic analysis of Akt1, showing specific domains and the disordered linker region that is not conserved between the specific human Akt1–3 isoforms; (right) X-ray crystallographic analysis of EGFR showing the ROS-sensitive functional cysteine. (Inset) A schematic of natural ROS and RES commonly encountered. Left to right under RES: 4-hydroxynonenal (HNE), sulforaphane, and 15-deoxy-Δ12,14-prostaglandin J2. Note the α,β-unsaturated carbonyl electrophile is a common motif in natural RES, making the basic reactivity of endogenous electrophiles similar to drug-like covalent pharmocophores.
(B) Sequence logo highlighting the amino acid sequence conservation within the linker region of either Akt2 (top) and Akt3 (bottom), across 10 and 36 species, respectively. The species are the same as those shown in Fig. 4. Relative sizes of residues reflect their frequency and the Y-axis indicates the information content of the position in bits. The sequence logo was generated using WebLogo (invented by Steven E. Brenner et al., Computational Genomics Research Group, University of California, Berkeley).