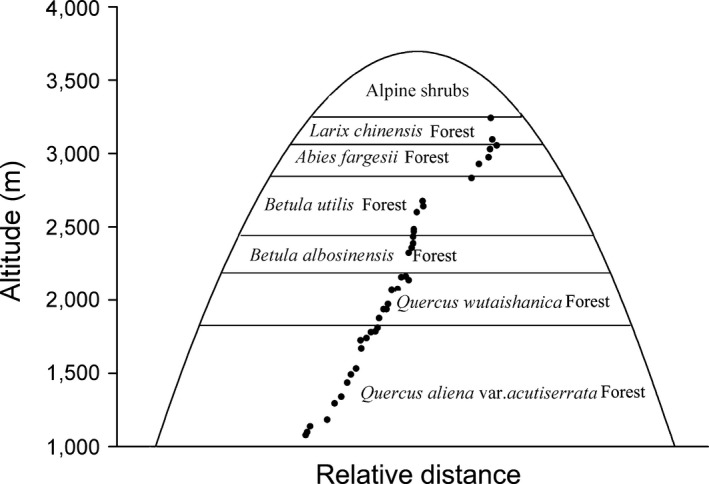
Figure 1.

Example of sampling plots. Zonal zone in graph represents the range of this forest type labeled by words. Black plots in graph represent our sampling plots, and relative position of plots on abscissa means the relative distance among plots. Position of plots on ordinate represents the elevation of each plot
