Figure 2.

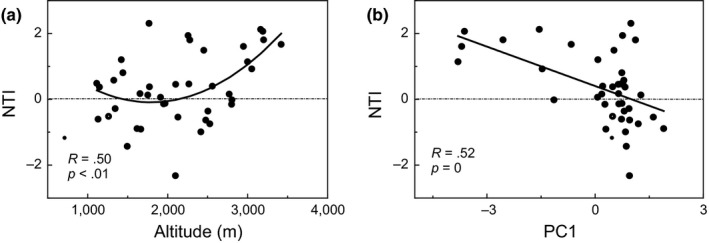
Phylogenetic structure change along environmental gradients. NTI is nearest taxon index. PC1 is the scores of plots on PCA 1 axis. The dotted line represents null expectation

Phylogenetic structure change along environmental gradients. NTI is nearest taxon index. PC1 is the scores of plots on PCA 1 axis. The dotted line represents null expectation