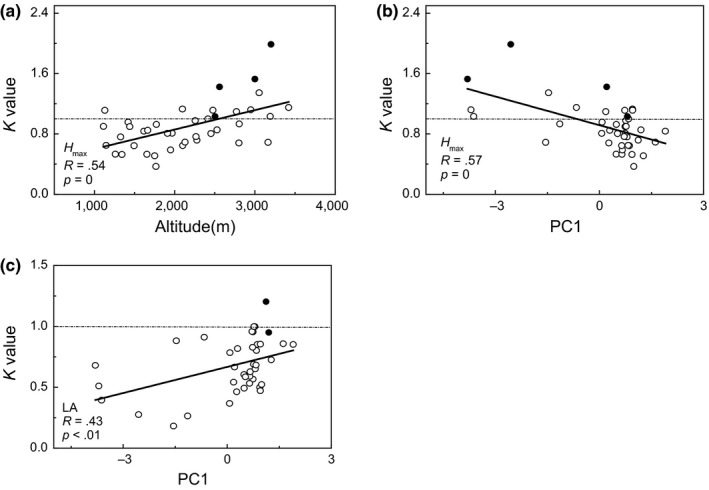
Figure 5.

Phylogenetic signal change along gradients. K value is the value of Blomberg's K for each trait in every community. PC1 is the scores of plots on PCA 1 axis. Hmax is maximum plant height, LA is leaf area. Solid cycle in graph means a phylogenetic signal with statistical significance. The dotted line represents Brownian Motion
