
Figure 3.
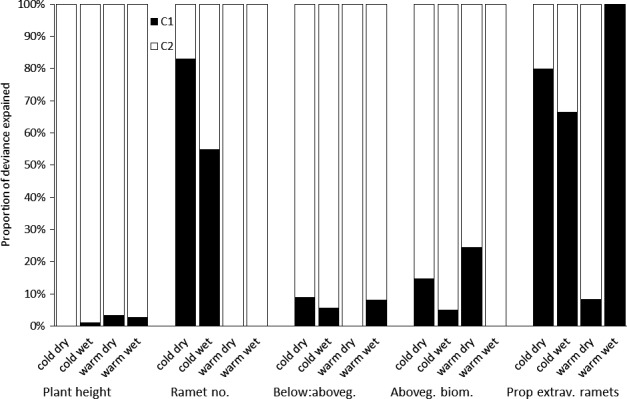
Effect of maternal conditions (C1) and conditions of cultivation (C2) on the different traits in each population separately. The values show proportion of the deviance explained by all significant variables in the model. Black bars of the columns indicate deviance explained by maternal conditions (C1) alone or in interaction with other factors; white bars indicate effect of offspring conditions (C2)