
Figure 3.
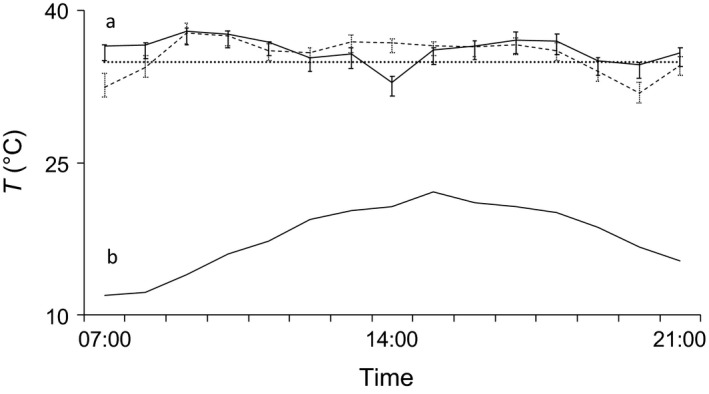
Simultaneous daily thermal patterns of two female Barbastella barbastellus roosting together in the same social group. Solid line in the upper part of the figure (a) shows skin temperature of a nonreproductive female, dashed line that of a lactating female; point line: torpor onset threshold. Solid line in the lower part of the figure (b) shows ambient temperature. Error bars show ±1 standard deviation. Sunrise and sunset times on sampling day were, respectively, 05.45 and 20.36