
Figure 2.
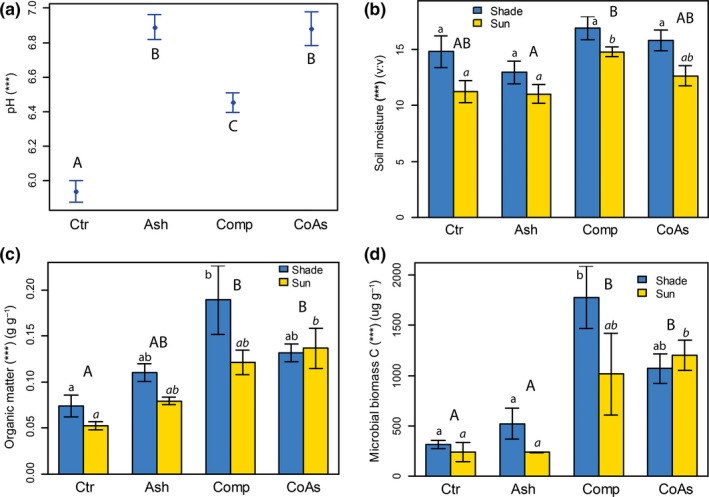
Mean (±standard errors) soil pH (a), moisture (b), organic matter (c), and microbial biomass (d) according to the different treatments. For abbreviations, asterisks and letters, cf. Figure 1. Results for shaded and sunny plots are confounded for (a) because the effect was not significant