
Figure 4.
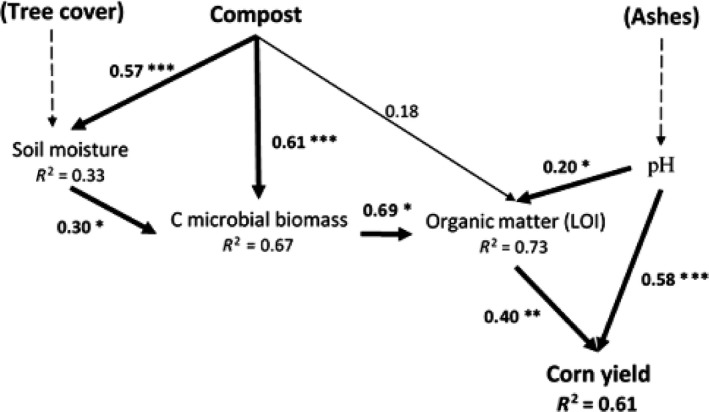
Structural equation model for the effect of compost and ash on corn yield. Bold arrows show significant relationships (pathways) between variables (for asterisks, cf. Figure 1), the thin arrow indicates a nonsignificant relationship, and numbers next to arrows show standardized parameter estimates (i.e., standardized regression weights). Dotted arrows indicate existing relationships which have not been integrated in the model for stability reason. Squared multiple correlations (R2) for the predicted/dependent factor are given below the dependent variables. All model fit indices were good: chi‐square = 7.65, p = .36, GFI = 0.91, RMSEA = 0.06, SRMR = 0.07 and AIC = 35.6