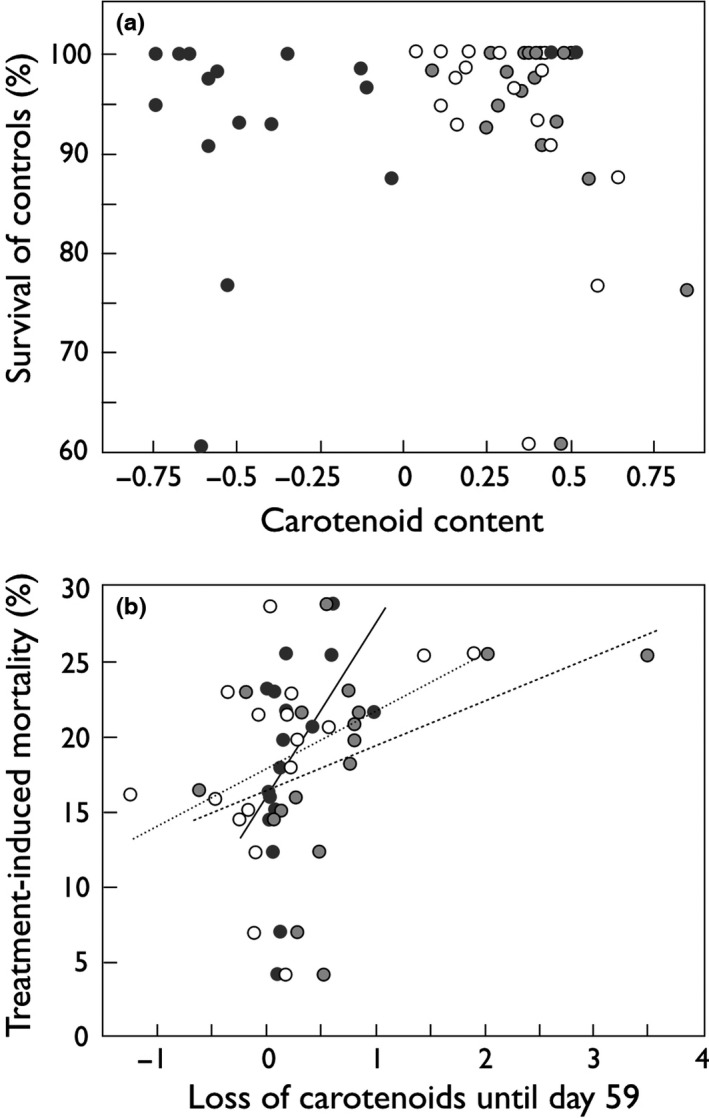
Figure 3.

Relationship between embryo survival and egg carotenoid content. (a) Mean embryo survival until hatching per dam (means of maternal half‐sib groups) versus carotenoid contents of unfertilized eggs (log10‐transformed means per dam in μg/ml), and (b) treatment‐induced mortality; for example, mean survival per dam in sham‐treated controls minus mean survival in highest stress treatment (nutrient broth at 1:500) versus reduction of carotenoid content from day of fertilization until 14 days after treatment (in μg/ml). Astaxanthin: black symbols and nonhatched regression line; zeaxanthin: gray symbols and hatched regression line, lutein: open symbols and dotted regression line. See Tables 2 and 3 for statistics. Regression lines illustrate the direction of significant effects
