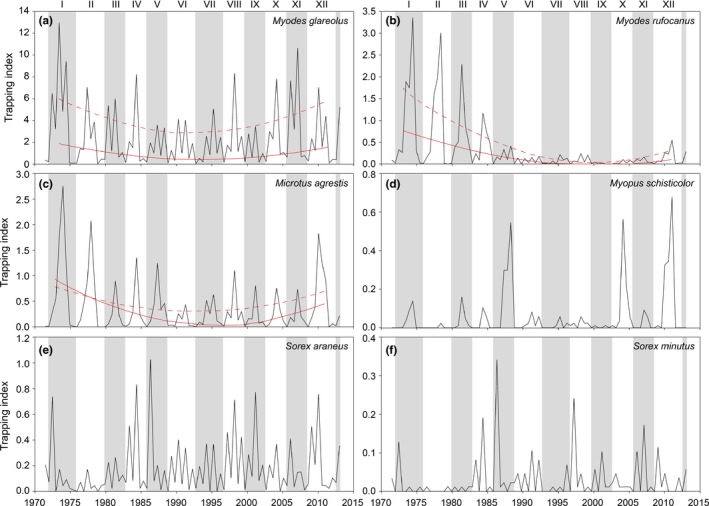
Figure 2.

Density of the six most common small mammal species in the study area near Umeå (a‐f), as revealed by trapping indices in spring and autumn in 1971–2013 from autumn 1971, and representing 12 complete cycles (I–XII) of which every second cycle is indicated by shading. Note the different scales of the trapping index for the respective species. Fitted lines show significant changes in the trapping index in spring (continuous lines) and autumn (dashed lines) for the three vole species. See S1 for the statistical analyses
