
Figure 9.
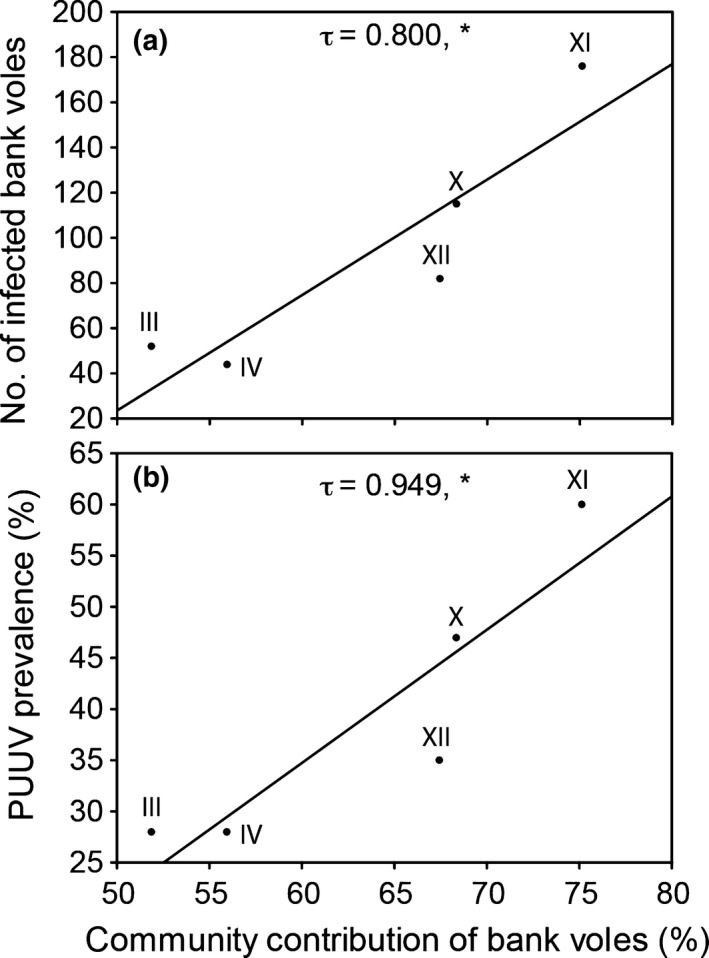
Relationship of the cumulated number of PUUV‐infected bank voles (a) and average PUUV prevalence (b), in spring per cycle (III–IV, X–XII), with the community contribution of the bank vole (M. glareolus). Fitted lines from linear regression analysis indicate significant correlations. Kendall's tau values and significance are given (*p < .05).