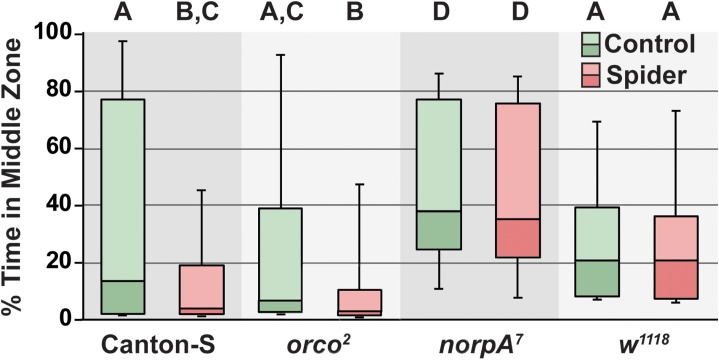
Fig 3. Visually impaired flies do not avoid the caged pantropical jumping spider.
The mean % time spent in the middle zone adjacent to the central cage is shown for wild type and the indicated sensory mutants. Each genotype was examined with and without the presence of a pantropical jumping spider within the central cage. Significance differences are indicated by letters above each experimental groups. Groups sharing a letter are not different according to Dunn’s test (α = 0.0018). The middle line of each box plot represents the median, while upper and lower box display the 3rd and 2nd quartile respectively. The whiskers show the 90% confidence intervals.

