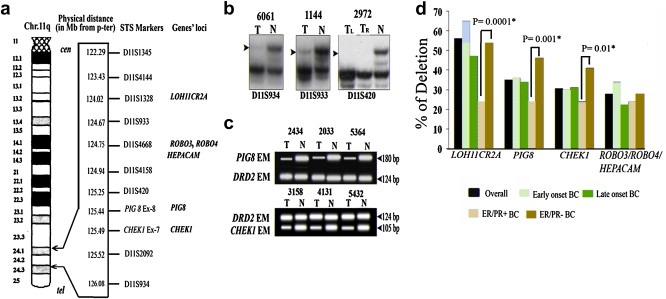
Figure 1.

(a) Schematic representation of the candidate genes of Chr.11q24.1‐24.2 and their intragenic/adjoining STS markers. (b) Representative autoradiographs showing deletion (LOH) of BC samples at different marker loci. (c) Representative photograph of HED with PIG8 and CHEK1 exonic marker (EM) performed by multiplex PCR with the control DRD2 EM. (d) Frequency of deletion of candidate genes in overall BC, Early‐onset, Late Onset, ER/PR+ and ER/PR‐ BC. Significant higher deletion in ER/PR‐ than ER/PR + BC is shown by asterisk. T: Tumor DNA; TR: Tumor DNA from right breast, TL: Tumor DNA from left breast N: DNA of the corresponding normal tissue.
