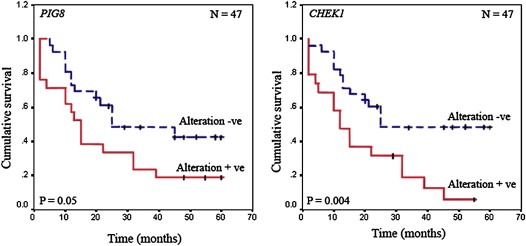
Figure 6.

Kaplan Meier 5‐year survival probability curves with cumulative survival of BC patients by alteration status of PIG8 and CHEK1 in early‐onset BC. Survival time was defined as the time from surgery to the patient's death, known recurrence or the last time the patient was known to be alive. The smooth line represents survival probability without overall alterations and the dotted line represents the same probability with molecular alterations.N denotes sample size.
